

In brief
- Ethereum sits 13.8% from its all-time high versus Solana’s steeper 34.12% climb.
- Prediction market Myriad places odds at 62% that ETH hits a new high before any major drop.
- Myriad users are bearish at the moment on a new SOL high. Here’s what the charts are looking like.
Goodbye “red September,” hello “Uptober.” As the bullish vibes return to the crypto market, traders appear to be setting their sights on risk assets beyond just Bitcoin, with Ethereum and Solana—two of the largest altcoins by market capitalization—each rising 5% today. So where are traders most likely to place their bets next?
The month that traditionally punishes crypto investors ended up delivering a 3.5% gain for the total market cap, defying the doomsayers who predicted blood in the streets based on historical data. Now October has arrived—what traders call “Uptober” for its historically bullish performance—and the hunt for new positions is on.
Two of crypto’s most important altcoins have become the center of intense speculation as permabulls pound the table for new all-time highs. Ethereum and Solana, the twin giants of smart contract platforms, are both within striking distance of their record prices. But which gets there first?
Prediction markets have spoken, and they’re split.
On one side, users on Myriad—a prediction market built by Decrypt’s parent company Dastan—say there’s a 62% chance Ethereum will reach $5,000, a new all-time high price, before it drops to $3,500. It’s an overwhelming confidence that reflects simple mathematics. ETH needs less than 15% to hit new heights from its current $4,144.89 price. Interestingly, these odds are way up from just last Friday, when Myriad predictors gave ETH just a 32% chance of reaching a new record price.
Solana tells a different story. Traders on Myriad have set the line at 52.4% that SOL does not mark a new all-time high by the end of this year. And this skepticism also makes sense: Solana sits at $210.95, requiring a 34.12% surge to reach its $295.11 peak. That’s a much steeper mountain to climb, compounded by uncertainty regarding if and when Solana ETFs hit Wall Street and historically lower institutional adoption. These odds have been trending in the opposite direction from the Ethereum market on Myriad, with users having previously given SOL a 67% chance of hitting a new high as recently as two weeks ago.
Ethereum vs Solana: What the charts say
To figure out which coin wins the race, we turned to Fibonacci fans rather than the standard retracements most traders use. Here’s the difference: retracements tell you price levels—where support and resistance live. Fans add time into the mix, projecting not just where price goes but when it should get there.
Think of retracements as saying, “The coin should stop at this level.” Fans instead say, “The coin should reach this level by this date if the trend holds.” For a race between two assets, that timing component changes everything. The fans draw diagonal trendlines from swing lows, creating a roadmap that factors in both price targets and the calendar.
Also, the charts today are configured using weekly candlesticks instead of the usual daily candlestick we normally analyze. This allows for the study of longer timeframes, reduces a lot of price noise, and gives a clear view of what could happen in a medium timeframe of several weeks ahead.
Ethereum’s technical setup
Ethereum’s chart screams opportunity, but with a caveat. The Relative Strength Index, or RSI, sits at 62—a goldilocks reading that signals strong momentum without approaching the dreaded overbought territory above 70. There’s room to run before profit-takers arrive.
The Average Directional Index, or ADX, at 32 confirms this isn’t just noise. ADX measures trend strength regardless of direction on a 0-100 scale. Readings above 25 indicate an established trend; above 40 signals extreme power. At 32, traders would say Ethereum’s uptrend has legitimate momentum behind it.
The moving average configuration adds another bullish layer. Ethereum’s 50-day exponential moving average trades above the 200-day EMA, which is a sign of a strong bullish movement. In layman’s terms, it means the average price of ETH over the short-term is trading higher than the average price over the longer term. This setup typically provides support during pullbacks, giving buyers multiple chances to enter on dips.
But here’s the wrinkle: The short-term trajectory shown by the dotted white trendline points downward. While the broader trend stays bullish, near-term price action could see consolidation or minor pullbacks.
The Fibonacci fan analysis suggests ETH could hit its all-time high anytime between next week (if current momentum holds) and December (if things slow down but the trajectory remains in play). If the trajectory is canceled, and ETH enters into a heavy correction, prices could move towards the $3K line and make bulls sweat heavy.
Key levels:
- Immediate support at $4,000 (psychological),
- Strong support at $3,500 (visual support)
- Immediate resistance at $4,500 (support/resistance in play since August),
ATH Target: $4,954.
Solana’s steeper mountain
Solana’s technical picture shows a coin still searching for its groove. The RSI at 59 indicates healthy buying pressure—similar to ETH but running slightly cooler. More concerning is the ADX at just 17, well below the 20 threshold that signals directional movement. This suggests choppy, trendless trading rather than a sustained push higher.
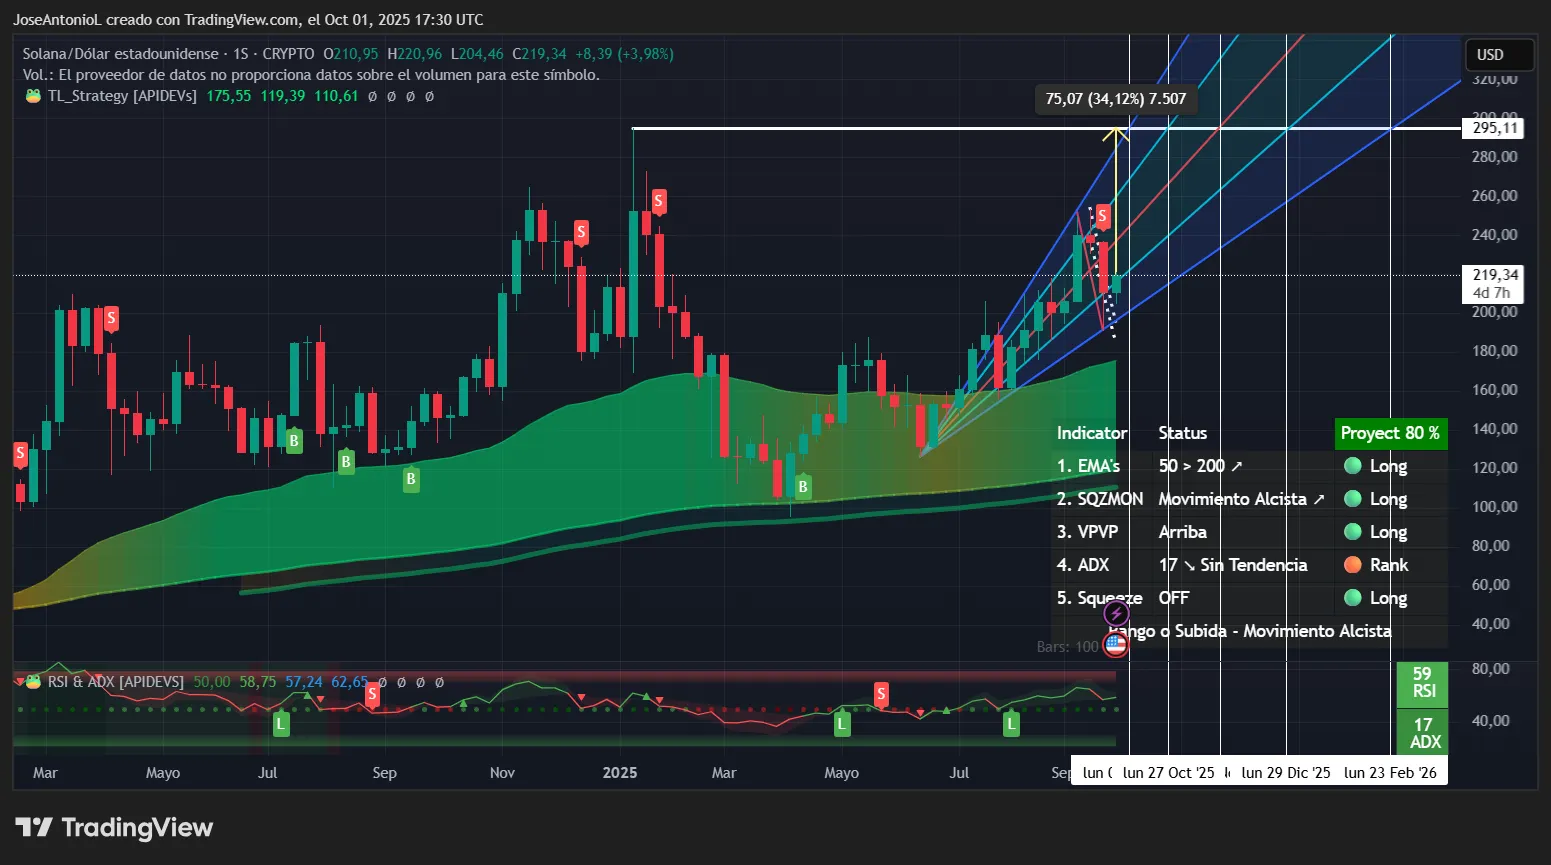
Low ADX readings work like compressed springs—the longer they stay compressed, the more explosive the eventual release. The Squeeze Momentum Indicator shows “off” with bullish status, suggesting the compression phase has ended and directional movement could be starting. SOL trades above both its 50-day and 200-day EMAs, providing a foundation for upside even if the path stays volatile.
The wild card? Multiple ETF issuers report “high conviction” that Solana ETF approvals could come as early as next week. Bloomberg’s Eric Balchunas wrote that new crypto ETF approvals are “really 100% now” thanks to generic listing standards. This is not part of the technical analysis, but is important to consider as it could be an event that affects the markets.
Fibonacci fans project a wider timeframe for Solana to reach all-time high levels—anywhere from late October 2025 to February 2026. This reflects both the larger percentage gain required and weaker trend conviction shown by that low ADX reading.
Key levels:
- Immediate support: $200 (psychological),
- Strong support: $187 (consolidation zone),
- Immediate resistance: $260
- All-time high target: $295.11.
The verdict
Pure mathematics favors Ethereum. A 13.8% move simply beats 34.12%, and ETH’s superior technical setup—stronger ADX, better-positioned RSI, tighter Fibonacci fan projection—reinforces this edge. The most likely scenario sees Ethereum reaching its all-time high first, potentially within weeks if momentum holds. That, of course, assuming this short-term correction is just that: a correction.
But Solana’s compressed volatility and potential ETF catalyst create an asymmetric risk-reward setup. History shows what happens when ETFs arrive: Bitcoin spiked after January’s approvals. Ethereum pulled massive institutional flows despite mixed initial sentiment. If Solana gets its ETF moment next week, that 34% gap could close faster than the charts suggest.
This may be just hopium, but there’s a lot of that in the crypto market.
Disclaimer
The views and opinions expressed by the author are for informational purposes only and do not constitute financial, investment, or other advice.
Daily Debrief Newsletter
Start every day with the top news stories right now, plus original features, a podcast, videos and more.